Area Report
Last updated 08 JUL 2026Neighbourhood Report
What's nearby — across walking, short-drive and school catchment distance. Data from official UK government sources.
01 — Snapshot
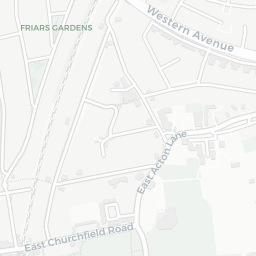
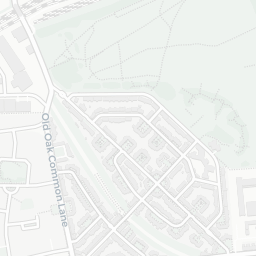
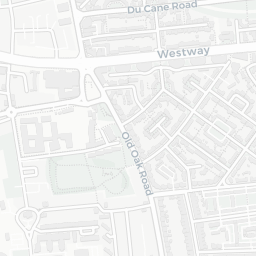
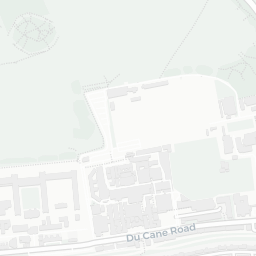
Around W3 7NZ.
The large figure is how many we found nearby; the chip beside each label is that category’s NestScope score out of 100 — higher beats more of the UK.
21Good/Outstanding within 1 mi
72 rated Good or better within 2 mi · 122 schools in total
Nearest top-rated: East Acton Primary School (Good) — 0.3 mi
64crimes last month
IMD crime decile 3/10 · 64 crimes in 0.25 mi last month (residential-weighted: 45.2)
Crimes reported last month · UK Police API
46GP & hospitals
IMD health decile 8/10 · 43 GP, 3 hospitals, 41 dentists, pharmacy 0.3 mi within 1.5 mi
Nearest GP: HAMMERSMITH & FULHAM CENTRES FOR HEALTH — 0.5 mi
East Acton Underground Station0.3 mi
East Acton Underground Station0.3 mi
40 bus stops also within 0.5 miles
28green spaces
IMD environment decile 2/10 · beside open access land (20.2 ha total — largest park 8.6 ha (0.29 mi away))
Nearest: Claydon Garden — 0.1 mi
77supermarkets
77 supermarkets within 2 mi — Lidl, Iceland, Tesco, Morrisons… — nearest 0.0 mi — library 0.8 mi
Nearest: Lidl East Acton — 0.0 mi
02 — Environment
Environment & risk near W3 7NZ.
Official risk flags for context — deliberately not part of the NestScope score (they’re categorical hazards, not amenities). Flood zones, air quality & noise explained.
Flood risk
Zone 1 (low)
Flood Zone 1 — low risk (less than 1 in 1,000 annual chance) · Source: Environment Agency Flood Map for Planning
Air qualityLow
19.3µg/m³
NO₂ annual mean · WHO guideline 10 · UK limit 40 · Source: DEFRA UK-AIR 2024
Road noiseLoud
72dB Lden
Road traffic, day-evening-night average · Source: DEFRA strategic noise mapping
Rail noiseQuiet
49dB Lden
Railways, day-evening-night average · Source: DEFRA strategic noise mapping
03 — House prices
Sold prices in W3.
Average sold price by property type across the W3 district, 2021–2026 — 4,352 sales.
About W3 7NZ
W3 7NZ scores 73/100 on the NestScope Score, with its strongest showing in local amenities and healthcare — with Lidl East Acton within a short walk. The breakdown below draws on official UK data covering schools, safety, healthcare, transport, environment and local amenities.
In national context, W3 7NZ is a mixed, mid-ranking neighbourhood — IMD decile 4/10, ranked 10,522 of 32,844 neighbourhoods in England. The Index of Multiple Deprivation is the UK government's official measure of relative deprivation, refreshed roughly every five years. Housing pressure here is high (IMD housing decile 1/10).
There are 122 schools within the typical catchment area, including 26 rated Outstanding by Ofsted and 46 rated Good. The nearest school is North West London Independent Special School, about 5 minutes' walk away.
There were 64 crimes reported on the surrounding streets in the most recent month, indicating a elevated level of immediate-area crime.
Healthcare access is good, with 43 GP surgeries, 3 hospitals and 41 dental practices in the wider neighbourhood. The nearest GP practice is HAMMERSMITH & FULHAM CENTRES FOR HEALTH, about 9 minutes' walk away. The nearest hospital is HAMMERSMITH HOSPITAL, about 13 minutes' walk away. A pharmacy is about 6 minutes' walk away.