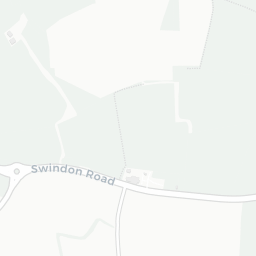
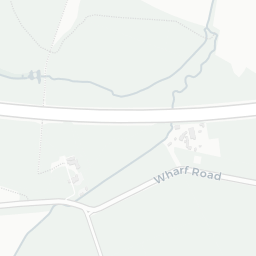
Nearest top-rated: Oliver Tomkins Church of England Infant and Nursery School (Good) — 0.6 mi
Safety91/100
6crimes last month
IMD crime decile 10/10 · 6 crimes in 400m last month (residential-weighted: 3.6)
Crimes reported last month · UK Police API
Healthcare77/100
4GP & hospitals
IMD health decile 6/10 · 4 GP, 5 dentists, pharmacy 0.3 mi within 1.5 mi
Nearest GP: PHOENIX SURGERY — 0.7 mi
Transport76/100
No rail stations within 0.5 miles · 25 bus stops nearby
Green space78/100
12green spaces
IMD environment decile 10/10 · 10.9 ha total — no proper park nearby
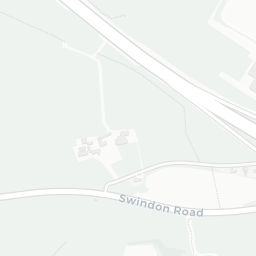
Nearest: Playground (100 m²) — 0.1 mi
Amenities81/100
13supermarkets
13 supermarkets within 2 mi — Tesco, Asda, Marks and Spencer, Waitrose… — nearest 0.3 mi — library 0.8 mi
Nearest: Tesco Swindon Freshbrook Express — 0.3 mi
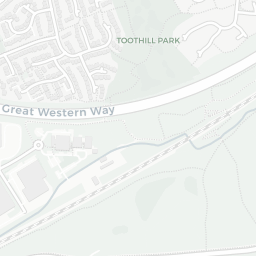
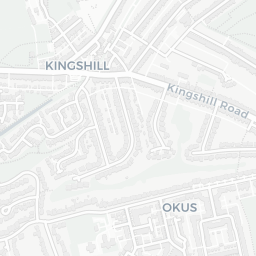
02 — Environment
Environment & risk near SN5 8QL.
Official risk flags for context — deliberately not part of the NestScope score (they’re categorical hazards, not amenities).
Flood risk
Zone 1 (low)
Flood Zone 1 — low risk (less than 1 in 1,000 annual chance) · Source: Environment Agency Flood Map for Planning
▼
Zone 1
Zone 2
Zone 3
Air qualityWithin WHO guideline
8.7µg/m³
NO₂ annual mean · WHO guideline 10 · UK limit 40 · Source: DEFRA UK-AIR 2024
▼
<10
10–20
20–30
30–40
≥40
Road noiseModerate
55dB Lden
Road traffic, day-evening-night average · Source: DEFRA strategic noise mapping
▼
<55
55–64
65–74
≥75
Rail noiseQuiet
42dB Lden
Railways, day-evening-night average · Source: DEFRA strategic noise mapping
▼
<55
55–64
65–74
≥75
03 — House prices
Sold prices in SN5.
Average sold price by property type across the SN5 district, 2021–2026 — 2,824 sales.
Detached
Semi-detached
Terraced
Flat
Detached£427k▲ 9.2%
Semi-detached£245k▼ 3.7%
Terraced£238k▲ 18.8%
Flat£143k▲ 9.4%
District-level averages (SN5) — broad enough to show a reliable trend. A single postcode usually sees too few sales to chart. Source: HM Land Registry Price Paid Data (Crown Copyright / OGL v3.0).
About SN5 8QL
SN5 8QL scores 82/100 on the NestScope Score, with its strongest showing in safety and local amenities — with only 6 crimes reported on the surrounding streets last month. The breakdown below draws on official UK data covering schools, safety, healthcare, transport, environment and local amenities.